


Positioning Through Volatility With a Disciplined, Opportunistic Framework
A guiding principle I return to often is that “history tends to reward those who find a way to be bullish when it’s difficult.” While I frequently champion constructive optimism, the recent volatility has been undeniably uncomfortable—testing the resolve of even the most experienced managers. But volatility is not a flaw in the system; it is the system. For active managers, it presents a recurring opportunity to identify dislocations, accumulate leadership, and position for the next advance.
This week, we step back from the noise and evaluate the market through a tactical lens to determine whether the weakness we've experienced is signaling deeper structural damage—or simply a reset within a prevailing uptrend.
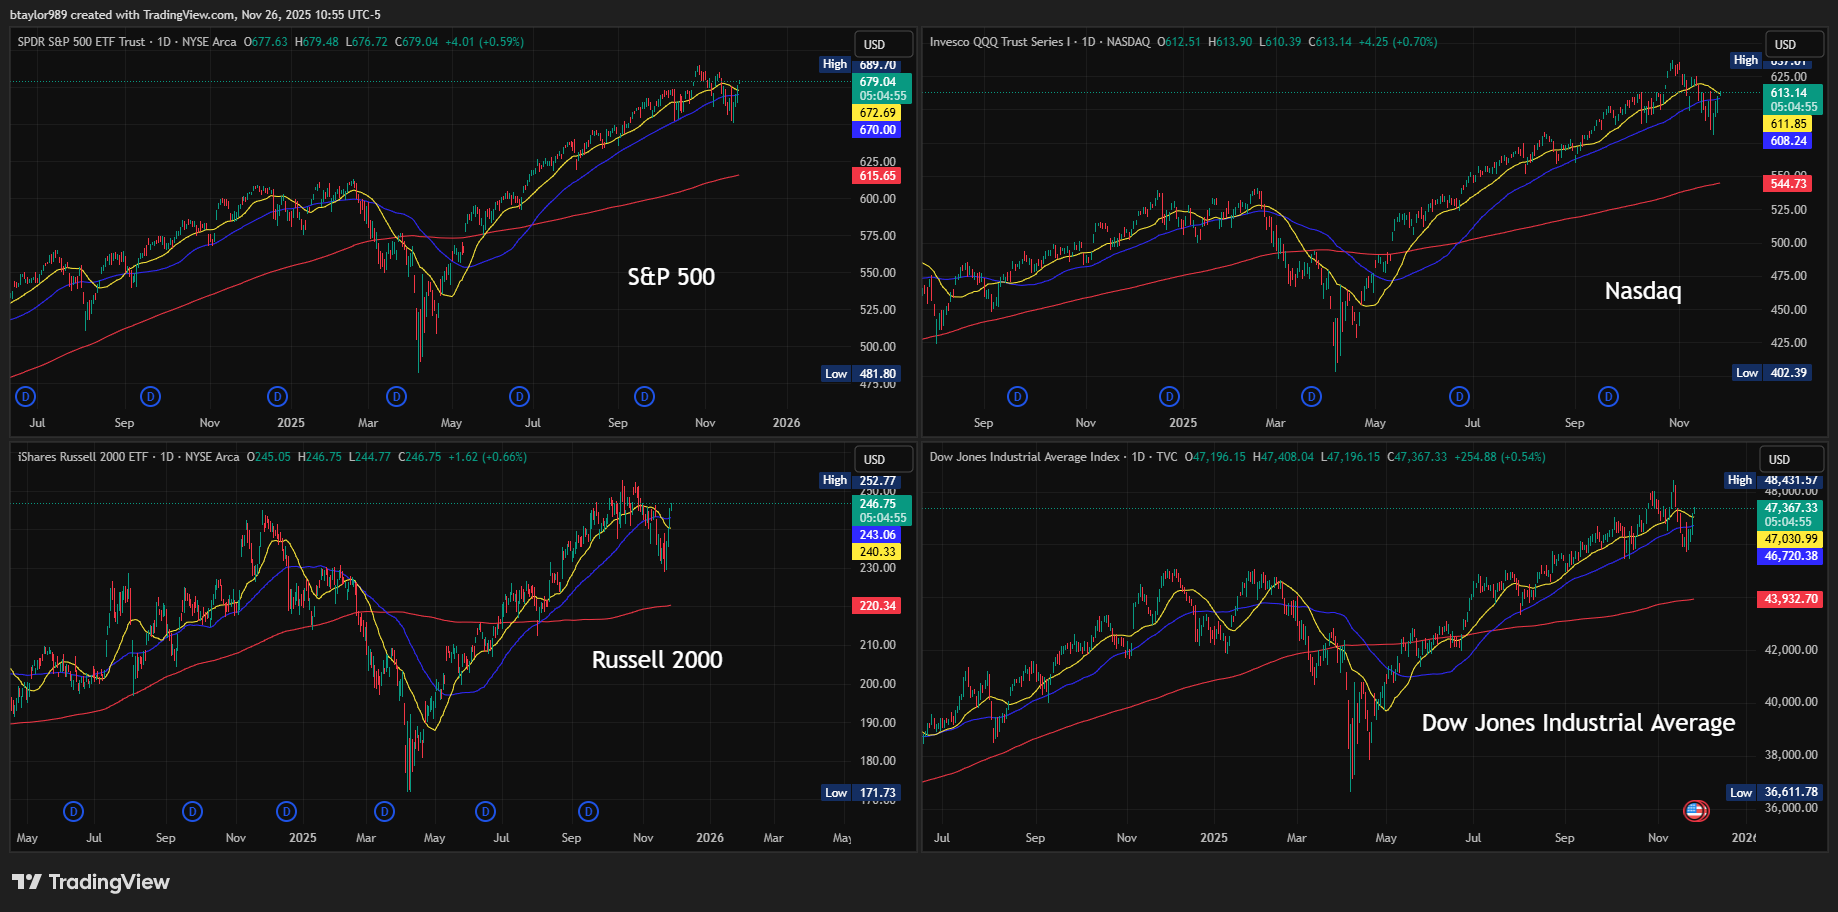
Trend: Retests Within an Uptrend, Not Trend Reversals
As of this writing, all four major domestic indices (S&P 500, Nasdaq, Russell 2000, and Dow Jones Industrial Average) have reclaimed both their short- and intermediate-term moving averages (20- and 50-day). In sustained bull markets, pullbacks toward these levels are not abnormal—they are healthy. Historically, trend retests occur frequently within larger secular advances and often present some of the best risk-adjusted entry points.
It’s important to contextualize the recent volatility against an unusually stable backdrop. The Nasdaq and S&P both entered November coming off near-record winning streaks:
The Nasdaq had traded within 5% of all-time highs since May—the 3rd longest stretch on record.
The S&P remained within 3% of its highs since June—the 7th longest run since 1950.
Meanwhile, the Dow has now logged over 150 trading sessions without a single -2% down day, underscoring the depth of the market’s resilience.
The question for investors is whether recent weakness indicates the start of something larger—or a classic late-cycle shakeout in an ongoing advance.
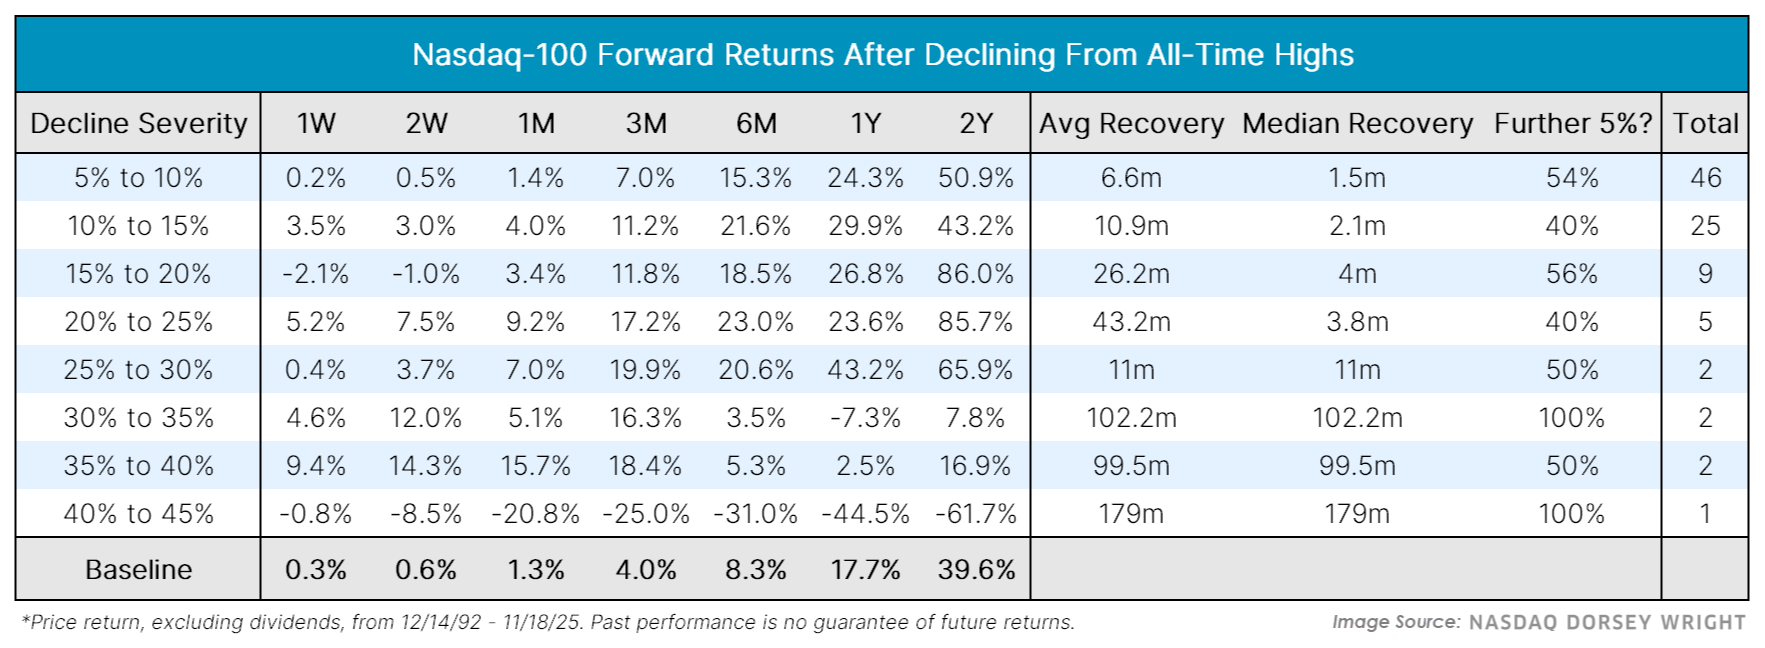
Looking specifically at the tech-heavy Nasdaq, the -8.83% drawdown from its October 29th high is well within historical norms. Of the 46 similar declines of this magnitude since 1993:
Average 6-month return: +15.3%
Average 12-month return: +24.3%
Median recovery time: 1.5 months
Drawdowns of this size remain features—not threats—of a bull market. The Nasdaq is still up over 55% in the past two years despite weathering six separate 5%+ declines during that period. The weight of the evidence supports the view that we are experiencing the end of an unusually calm stretch, not the beginning of a structural breakdown.
Volatility: A Return to the Mean After a Fear Spike
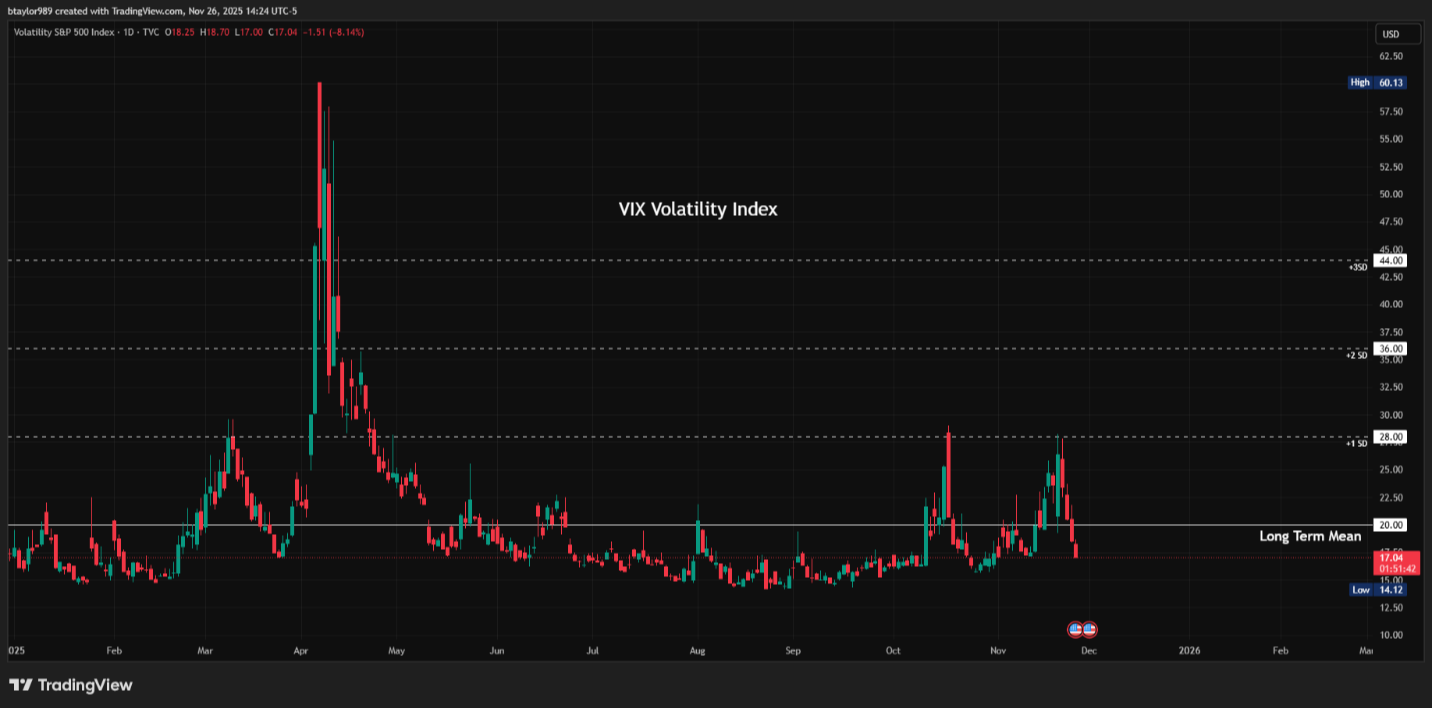
The VIX, by nature, oscillates between volatility regimes, and those regimes can persist. Notably, both the highest and lowest volatility periods since 2000 occurred under the Trump administrations—a reminder that volatility often has a macro-policy component.
The key level to watch is the long-term mean around VIX 20. We recently shifted above that mark, reaching as high as 28—a +1 standard deviation move associated with palpable fear. However, the VIX has since reverted to its mean. Where volatility moves from this “line in the sand” will be a defining factor for near-term positioning, but the recent reversion suggests panic conditions have cooled rather than accelerated.
Breadth & Concentration: Recognizing the Risks—and the Setup
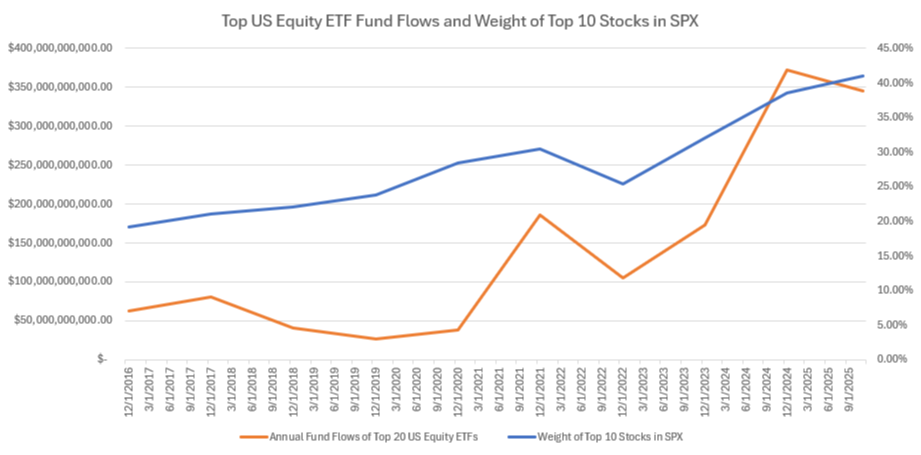
Concentration remains a meaningful concern. Since 2016, the top 10 stocks in the S&P 500 have doubled their share of the index and now account for over 40% of total weight. The extraordinary performance of mega-cap technology has fueled returns for many portfolios, but it has also limited diversification and funneled flows into a narrow leadership cohort.
This feedback loop—strong performance → stronger passive inflows → even stronger performance—has left markets more vulnerable to sharp, flow-driven corrections. When ETF and mutual-fund flows pause or reverse, liquidity in concentrated leadership can evaporate quickly, often producing swift corrections like the one we’ve just witnessed.
However, history also shows that these dislocations tend to be brief. Once flows normalize, leadership typically reasserts itself and markets recover quickly toward new highs.
Breadth: Quiet Improvement Beneath the Surface
While overall breadth remains soft, the early signs of improvement are noteworthy. Over the past three trading sessions, the NYSE has posted more than 4,000 advancers over decliners—a breadth “thrust” reminiscent of the powerful surge that followed the April lows and fueled this year’s mid-summer rally.
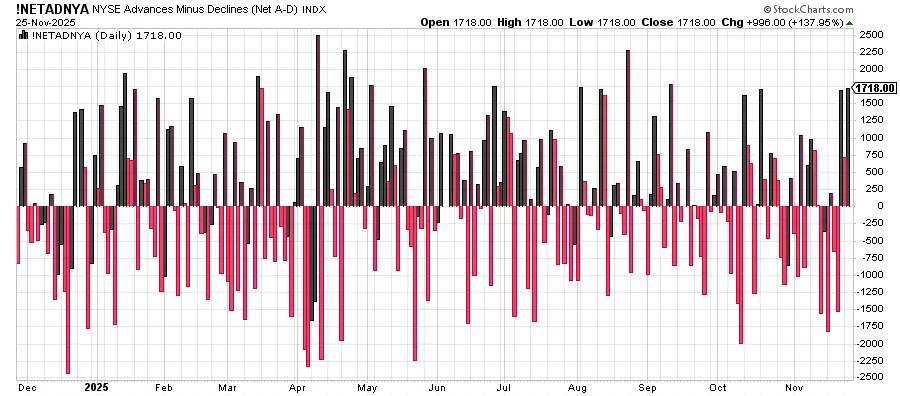
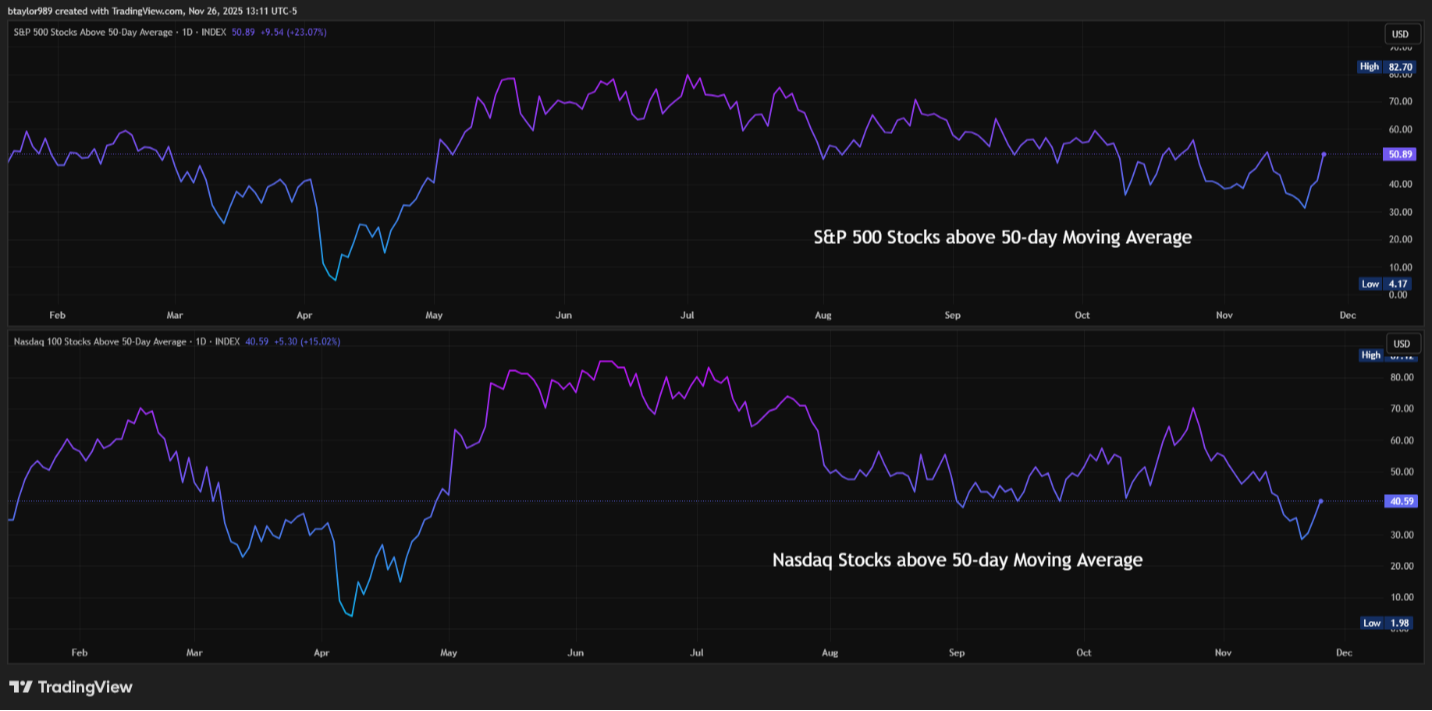
Additionally, Thursday marked a meaningful shift: both Nasdaq and S&P constituents saw a net increase in stocks reclaiming their 50-day moving averages, reversing the prior deterioration in intermediate-term trend structure. These are the types of subtle but critical signals that typically precede broader market stabilization.
Conclusion: A Reset, Not a Reversal
Despite the discomfort, the balance of evidence points toward this volatility being a healthy reset rather than a structural breakdown. Trend behavior, volatility normalization, improving breadth, and the context of recent concentration all suggest the market is digesting exceptional gains—not unraveling them.
In bull markets, drawdowns of this magnitude are not only normal—they’re historically followed by strong forward returns. With major indices regaining key technical levels and early signs of recovery emerging beneath the surface, the market appears to be stabilizing after a brief, fear-driven dislocation.
History has consistently rewarded investors who remain constructive when conditions feel most uncertain. This is a moment to stay disciplined, stay tactical, and recognize that volatility often serves as the catalyst for the next set of opportunities—not the end of them.
For clients seeking deeper insight or portfolio customization, I welcome the opportunity to connect. If you’re interested in exploring how our active strategy is navigating current dynamics—or how these conditions may create asymmetric opportunities tailored to your profile—please reach out to schedule a conversation.
The views stated in this piece are not necessarily the opinion of Cetera Wealth Services, LLC and should not be construed directly or indirectly as an offer to buy or sell any securities. Due to volatility within the markets, opinions are subject to change without notice. Information is based on sources believed to be reliable; however, their accuracy or completeness cannot be guaranteed. Past performance does not guarantee future results. Investors cannot invest directly in indexes. The performance of any index is not indicative of the performance of any investment and does not take into account the effects of inflation and the fees and expenses associated with investing. A diversified portfolio does not assure a profit or protect against loss in a declining market.